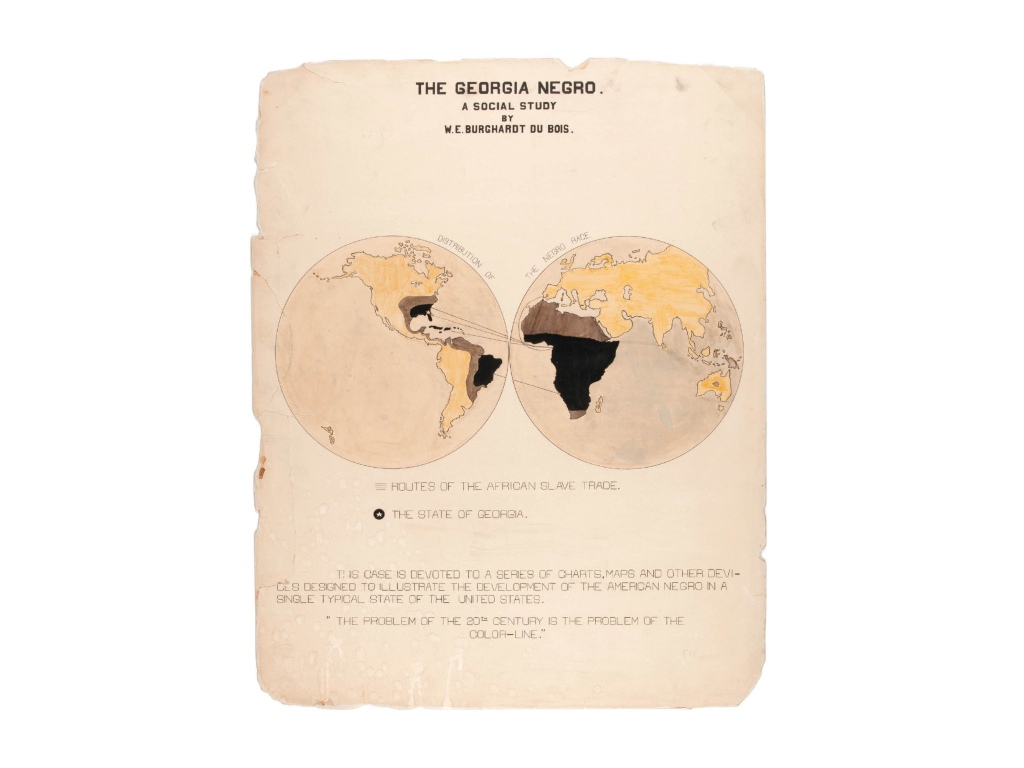
W.E.B. Du Bois is well known for his pioneering work in American sociology, and most especially his studies of the social situation of African Americans in the reconstruction South. He was a singularly important sociologist in his time, and a wide swath of Americans have read his Souls of Black Folk, where he made his famous observation, “The problem of the twentieth century is the problem of the color line.”
What is very less well known is an exhibition of brilliantly original data graphs that Du Bois and his team prepared in 1900 for the Exposition des Nègres d’Amérique in Paris. There roughly 60 data presentations were provided to capture the core statistical findings of his studies of the social status of African Americans in Georgia. They incorporate a stunningly modernist aesthetic towards the graphics of data presentation that transcends their time. And, like Edward Tufte’s Visual Display of Quantitative Information published some eight decades later, Du Bois challenged social scientists to find new graphical forms through which to convey their results to the public.
Whitney Battle-Baptiste and Britt Rusert’s W. E. B. Du Bois’s Data Portraits: Visualizing Black America provides a superb introduction to the exhibition, as well as high quality, full-color reproductions of all of the graphics. The volume does a fascinating job of locating both the sociological and the aesthetic innovations in the work. Consider this graph of black property ownership in Georgia.

This is a very interesting historical graph mapping the total value of property owned by urban African Americans in Georgia between 1870 and 1900. It is evident that the total value changed significantly during those 30 years, with a long period of growth and several sharp declines. What is most interesting are the text notes incorporated into the graph, identifying causes or effects of the inflection points. These events are of the greatest significance for the lives, freedoms, and security of African Americans in the South of reconstruction and Jim Crow. It is not an exaggeration to say that the graph encapsulates the history of Black America in the South during a crucial period at the end of the nineteenth century.
As a sociologist and investigator of the conditions of life for African-Americans in post-Civil War America, Du Bois undertook an extensive multi-year quantitative investigation of the black population of Georgia. The data from this research provide the foundation for much of the Paris exhibition, and fairly enough — Georgia was the most important concentration of the black population in the United States during those decades.
Du Bois’ team was interested in the demographic basics of the black population. But under Du Bois’ direction the researchers were also interested in the social and economic positions of various segments of the black population — employment, income, occupation, literacy, education, and health (through data on longevity). All of these factors are represented among the data graphs of the Paris exhibition.
Racial disparities in the field of health and preventable mortality are most tragic. Du Bois recognized this with his graphs of comparative mortality. Consider Plate 59 representing longevity of black individuals in the US and three economically distinct neighborhoods of black men and women in Philadelphia. The graphic shows dramatically higher mortality for poor black people than medium- and high-income black people. The figure demonstrates mortality disparities among black people by income. It does not provide comparable data for white populations, so estimating the breadth of disparities in mortality is not possible from this chart. We have to assume there were indeed very substantial disparities, but the data provided here does not address them.

What about the current day? Have racial disparities in health and mortality gradually lessened between white and black populations? By no means. Here is a graph provided in a study done by the Commonwealth Fund (link). This chart demonstrates wide disparities across black and white populations in most states, and especially strikingly in the states of the old South. The chart estimates preventable deaths per 100,000 by each racial group. In Florida black individuals are about 2.5 times more likely to die prematurely of preventable illnesses than white people. Governor DeSantis, why don’t you direct your energies towards addressing this horrendous racial injustice rather than ranting about “wokeness”?

It is poignant to realize that Du Bois appeared to have had measured optimism concerning the progress of the black population and the march towards greater equality. These hopes were dashed in the decades to come as an ever-more aggressive Jim Crow regime took hold to enforce segregation and discrimination — in housing, schooling, employment, and voting rights. Lynchings and brutal race riots continued, culminating in horrific events like the Ocoee Massacre of blacks in Florida in 1920 and the Tulsa race massacre in 1921. Citizens Councils, the Ku Klux Klan, and ordinary citizens made “long, slow progress” no longer a viable pathway towards racial equality.
What parts of this story can now be told honestly and forthrightly in classrooms in Florida today? Now more than ever we need truth-speaking about our historical pasts, and yet now more than ever white supremacist elected officials are seeking to silence the truth. It is hard not to hear the words of Governor George Wallace in 1963 in the rhetoric of Governor Ron DeSantis today: “Segregation today, Segregation tomorrow, Segregation forever!” W.E.B. Du Bois sought to discover and speak the truth about race in America. We must follow his example.

No comments:
Post a Comment